Paper, Plants in the UK flower a month earlier under recent warming
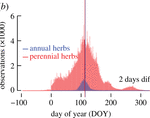
Global temperatures are rising at an unprecedented rate, but environmental responses are often difficult to recognize and quantify. Long-term observations of plant phenology, the annually recurring sequence of plant developmental stages, can provide sensitive measures of climate change and important information for ecosystem services. Here, we present 419 354 recordings of the first flowering date from 406 plant species in the UK between 1753 and 2019 CE. Community-wide first flowering advanced by almost one month on average when comparing all observations before and after 1986 (p < 0.0001). The mean first flowering time is 6 days earlier in southern than northern sites, 5 days earlier under urban than rural settings, and 1 day earlier at lower than higher elevations. Compared to trees and shrubs, the largest lifeform-specific phenological shift of 32 days is found in herbs, which are generally characterized by fast turnover rates and potentially high levels of genetic adaptation. Correlated with January–April maximum temperatures at −0.81 from 1952–2019 (p < 0.0001), the observed trends (5.4 days per decade) and extremes (66 days between the earliest and latest annual mean) in the UK's first flowering dataset can affect the functioning and productivity of ecosystems and agriculture.
Learn about our two Decals!
 Click here to find out more about our Fall Bioinspired Design Decal and our Spring Bioinspired Design in Action Decal – ALL MAJORS are welcome.
Berkeley BioDesign Community
 Click here to learn about the BioD: Bio-Inspired Design @ Berkeley student organization or here to signup for more info.
Search
Student Login


I imagine that the neurological circuits underlying these processes are governed by both 2d spacing maps with their brains as…
to reduce the impact of car accidents, it may be possible to study the force diverting physics of cockroaches to…
you see this type of head-bobbing stability in many avian creatures related to pigeons like chickens. the head ability to…
not like they taught horses how to run! this is an example of convergent evolution where both sea creatures and…
The brain functions in a similar way with neuronal connections. our brains are able to utilize the multiplicity of connections…